Chart Data
Refers to the structured dataset used to render visual elements such as bar charts, pie charts, or line graphs. This data is typically aggregated or summarized to highlight trends, categories, or metrics for quick insights.
note
Always click Save after making any changes to your artifact to ensure updates are stored successfully.
Create an Artifact (Data Set)
Follow the steps below to create a new artifact
- Navigate to the Dashboard → Data Fabric
- Open the Artifact section by clicking the "Artifact" tab in the navigation bar.
- Navigate to the application path: My Artifacts → Global-App-Group → reimbfast-app
- Click the (+) button at the bottom-left to create a new artifact.
- Enter a unique name for the artifact (e.g., chartData).
- Click Create Artifact to confirm.
- Click Save to save the artifact and close the window.
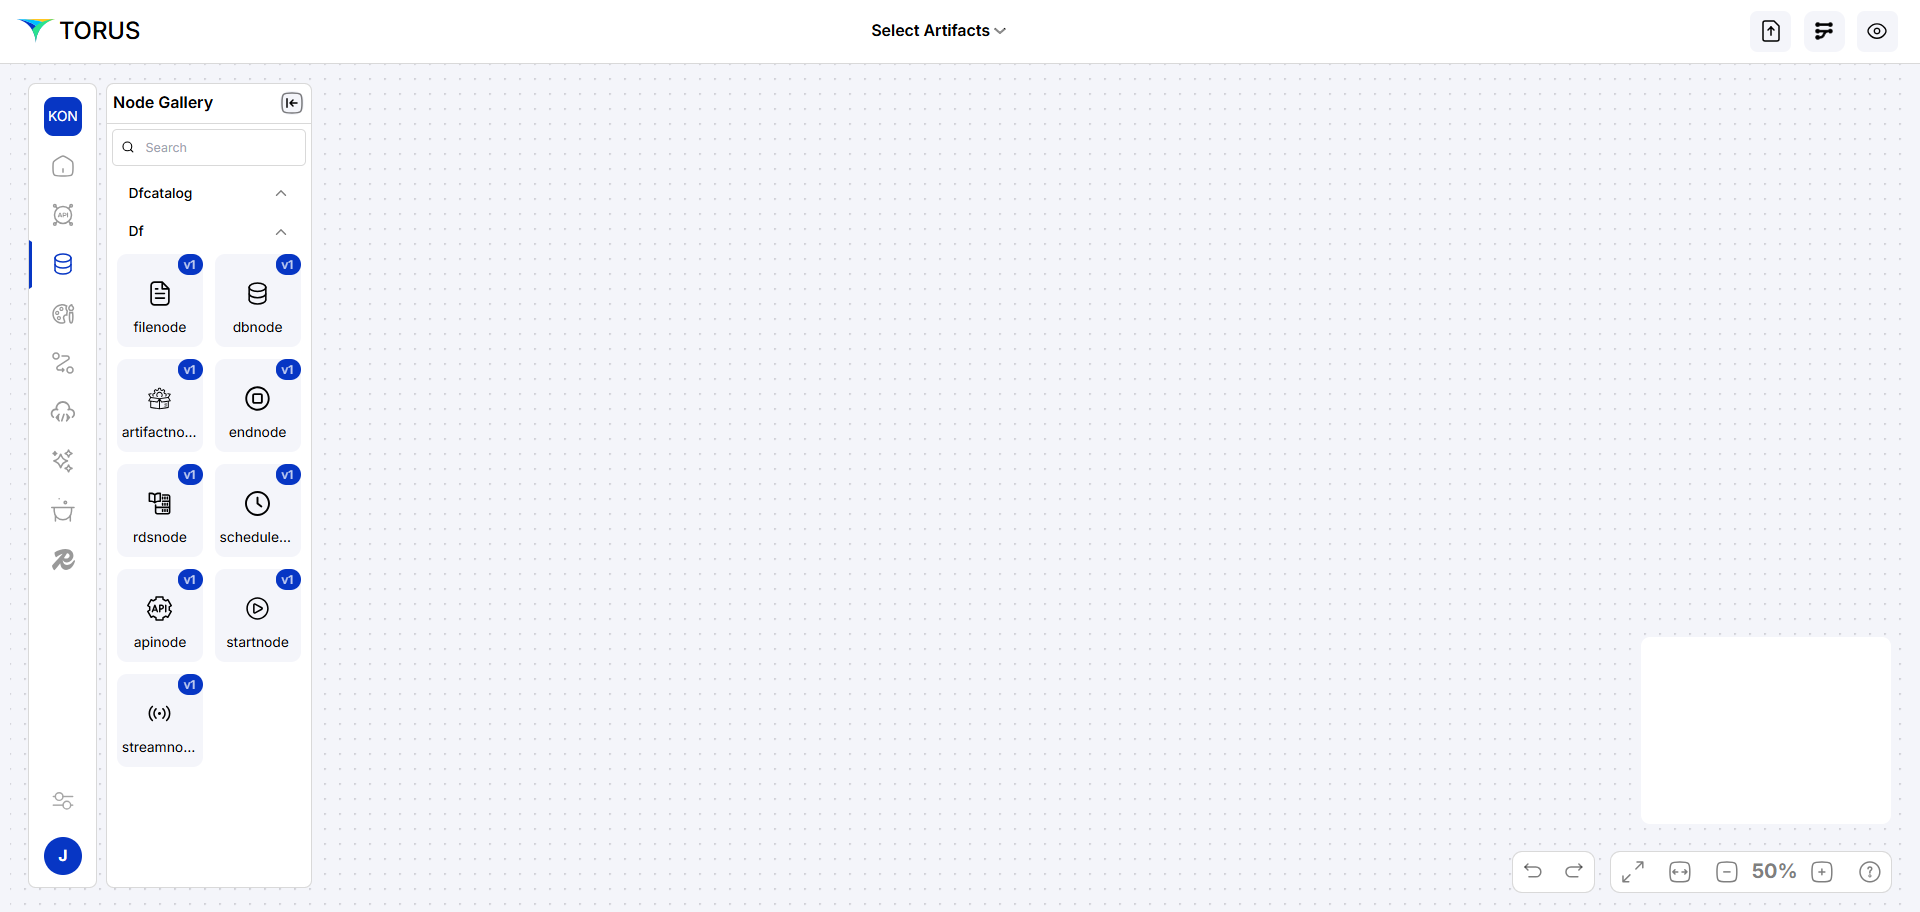
Node Gallery
- The Node Gallery provides key building blocks for data processing pipelines. Each node type serves a specific function:
| Node | Description |
|---|---|
| start node | Marks the beginning of a workflow. |
| endnode | Processes real-time data from sources like Kafka. |
| dbnode | Connects and interacts with database systems. |
Build Data Flow Diagram
- Use Node Gallery to drag nodes:
- startnode, endnode
- dbnode (for DB queries)
- Arrange nodes and connect them.
- Right-click DB node to configure node properties:
connectorName
- The name of the data connector is used to fetch data.
schemaName
- Represents the logical structure or namespace within the database, under which tables and objects are grouped.
tableName
- The specific table in the database which is designed in the ERD.
operationName
- The action being performed, such as read, insert, update, or delete—defines what the API or query is supposed to do.
linkParam
- A parameter used to dynamically pass values between nodes
key
- Refers to a unique identifier (often a primary key) used to match or reference specific records within a dataset.
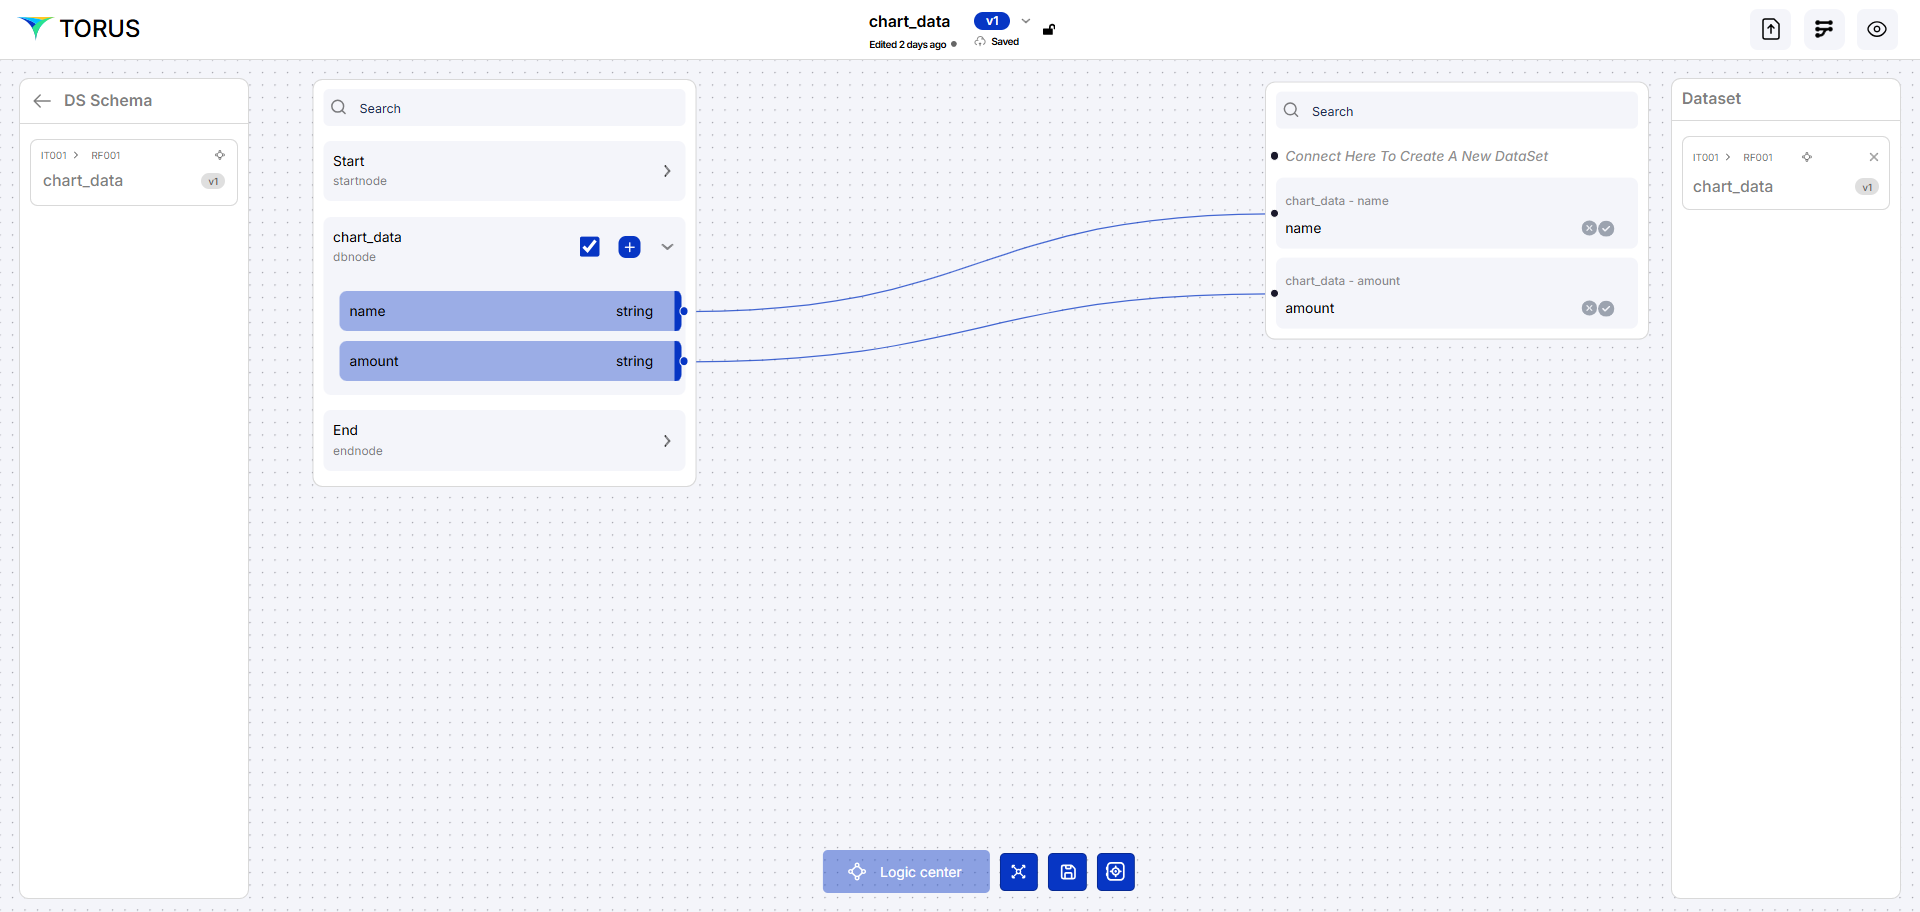
Chart Data Artifact:
- Drag start, DB, end nodes.
- Connector: DEV-Postgres-Aws
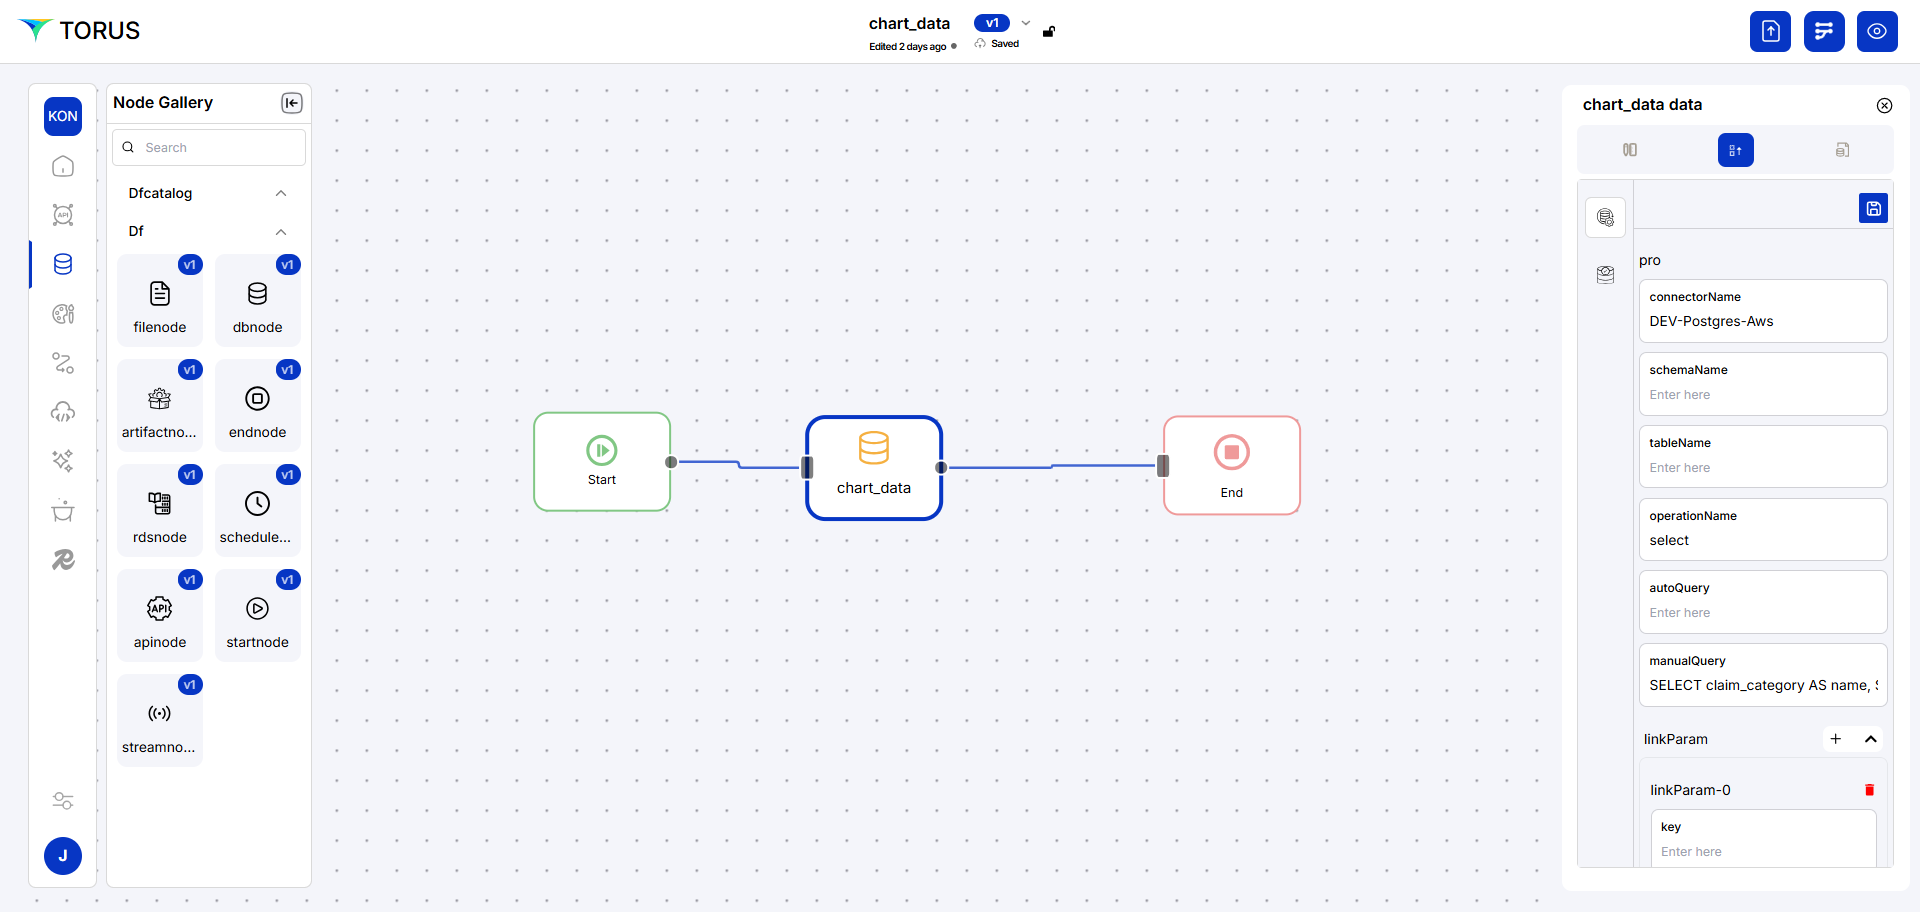
- Manual Query:
SELECT count(claim_id) AS approved_claims_count FROM tt005_rf001.claims WHERE status = 'Approved';
orchestration
- For each artifact, orchestrate data sources and processing flows.
- Use Logic Center to set:
- Security (policies, templates)
- Events (success, error handling)
- Actions (locking, TTL, pagination)